


As an internal KPI, the Revenue to Employee ratio is often used alongside Profit per Employee and Expenses per Employee. Monitoring these metrics over time is a good way to track growth or decline in overall efficiency. However it should be noted that the revenue per employee metric is only loosely correlated with total revenue, growth rates or market caps (so, don't over rotate on this one!).
Note that this metric only looks at the number of employees and doesn’t account for labour costs. Refer to Payroll to Revenue Ratio, Gross Margin %, and, to some degree, Profit Margin % to get the complete story.
Revenue per Employee by Industry
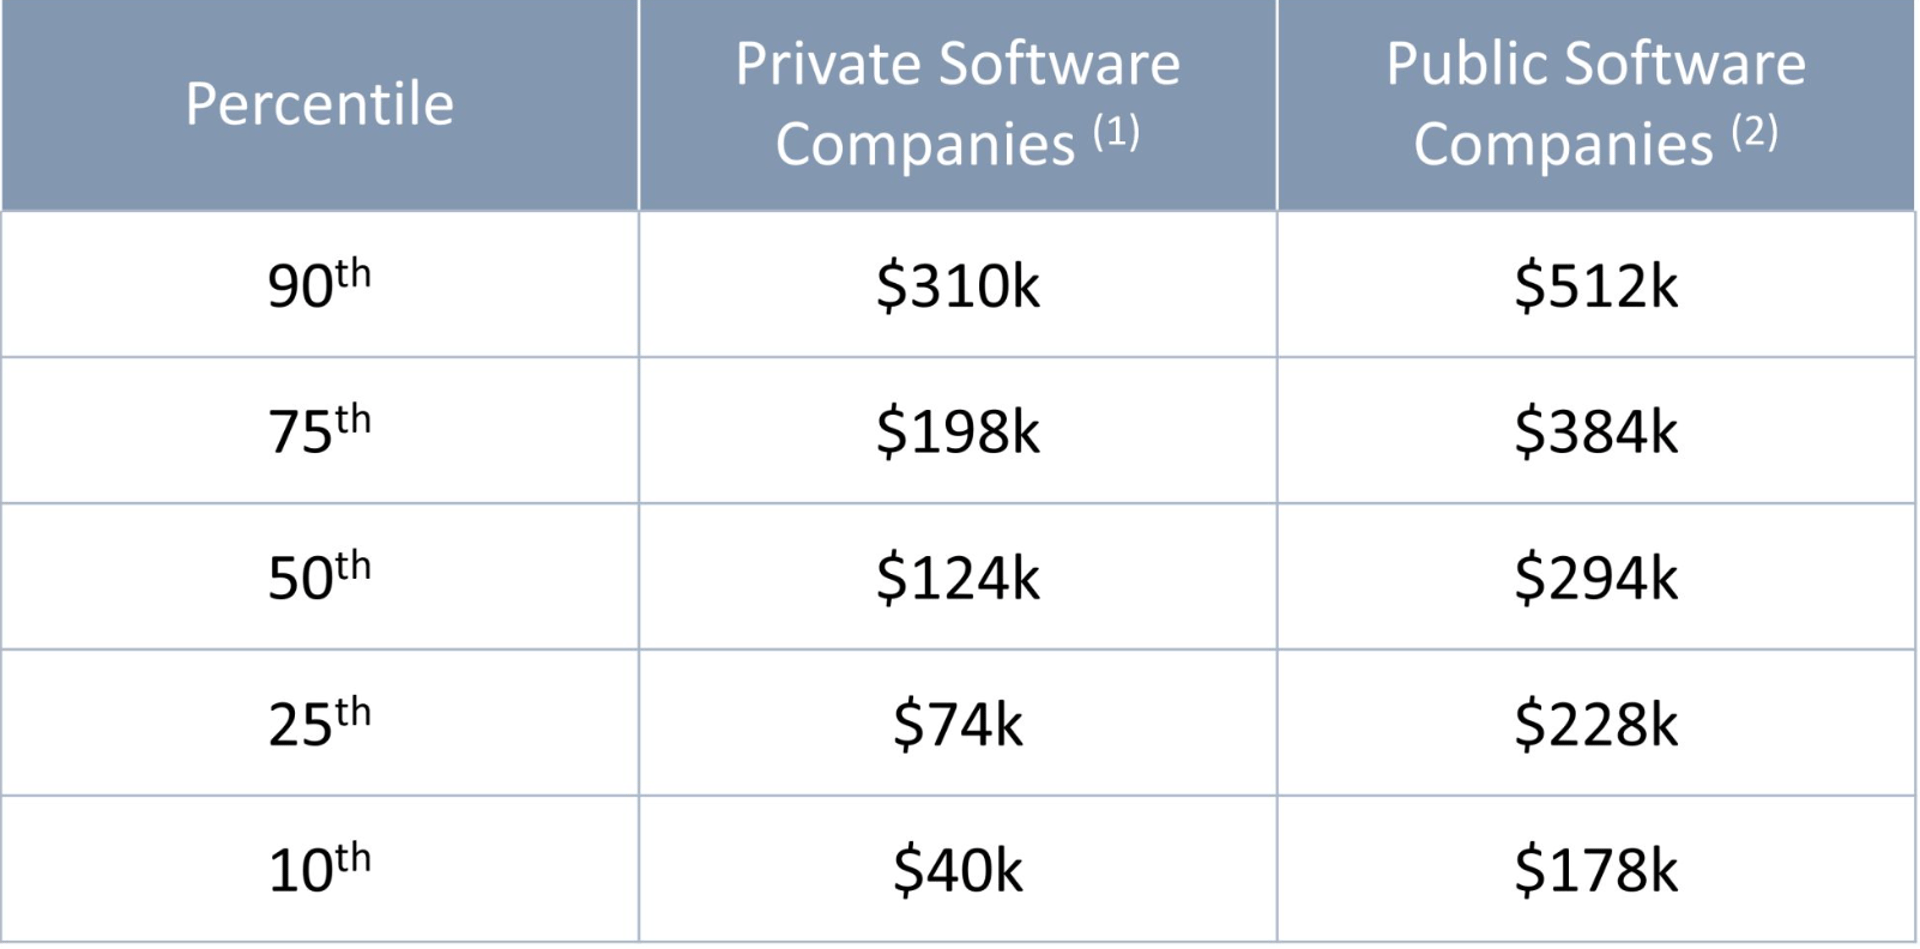
Revenue per Employee Ratio varies by industry. The Energy sector has the largest revenue per employee by far, followed by Healthcare and Utilities, all with more than $800,000 revenue per employee. Software and technology companies have an average revenue to employee ratio of around $400K.
Not only will the Revenue to Employee ratio change from industry to industry, but geography, subsidies, and, of course, company revenue stage will all produce differences. Geography and subsidies, which have an impact on labour costs may allow a company to hire more employees and potentially invest less in automation. Early stage companies often have a very low and volatile Revenue to Employee ratio, until they see their investments produce predictable revenue.