Cash Conversion Cycle (CCC)
Last updated: May 02, 2025
What is Cash Conversion Cycle?
The Cash Conversion Cycle, also knows as Cash-to-Cash Cycle Time, is the time between when a business pays its suppliers and when the business receives payment from its customers, usually expressed in days. Keeping active tabs on your Cash Conversion Cycle will aid you in monitoring your finances as cash flows in and out of your business.
Cash Conversion Cycle Formula
How to calculate Cash Conversion Cycle
It takes a widget manufacturer an average of 60 days to sell its inventory, and then having sold their widgets, takes them an additional 30 days to collect cash. In general the manufacturer pays its suppliers in 75 days. Cash-to-Cash Cycle Time = 60 Days Inventory Outstanding + 30 Days Sales Outstanding - 75 Days Payables Outstanding = 15 days. Note: Calculations for the components: DIO = Average Inventory / COGS X 365 (if values are annual) DSO = Average Accounts Receivable / Revenue Per Day DPO = Average Accounts Payable / COGS Per Day
Start tracking your Cash Conversion Cycle data
Use Klipfolio PowerMetrics, our free analytics tool, to monitor your data.
Get PowerMetrics FreeWhat is a good Cash Conversion Cycle benchmark?
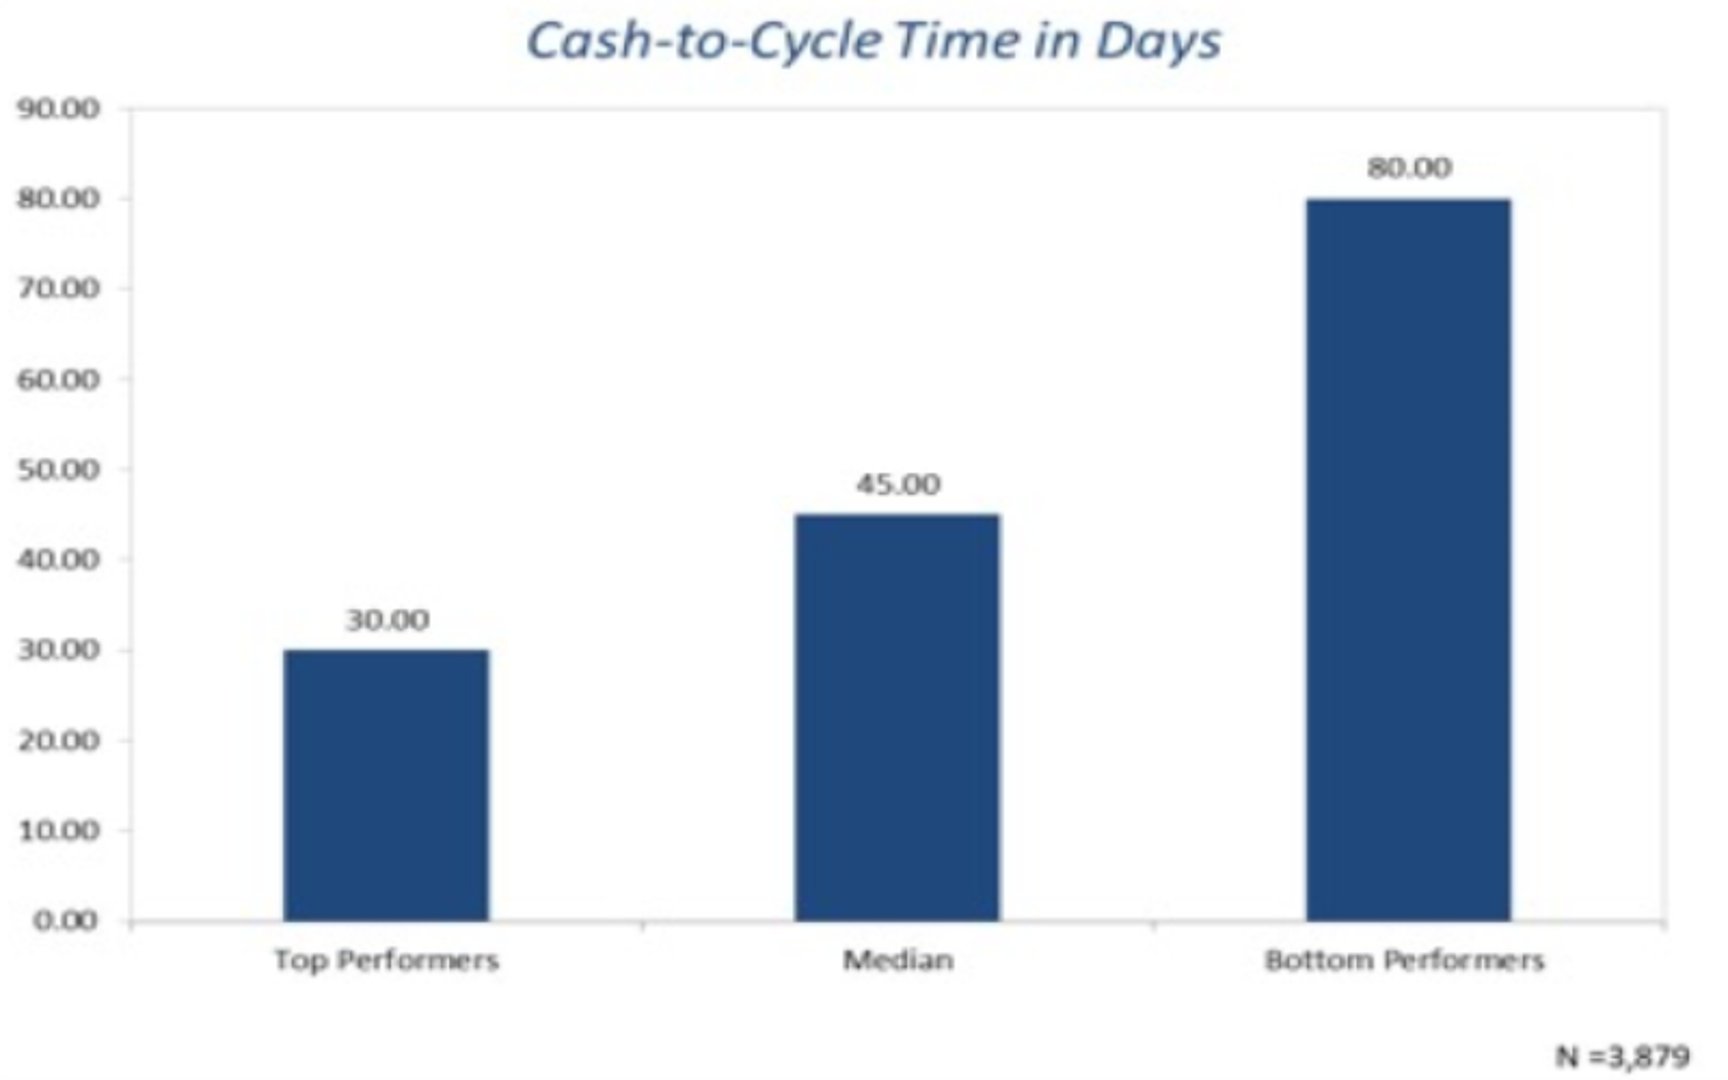
Although you should target a shorter cash-to-cash cycle time, the benchmark for this metric is between 30 to 45 days in general, according to APCQ's benchmark research.
Cash Conversion Cycle benchmarks
cash to cash cycle time_1.PNG
How to visualize Cash Conversion Cycle?
There's two ways you can look at your Cash Conversion Cycle data: track changes (which can indicate improvements or declined performance) over time or compare two periods of time to pinpoint specific events that may have triggered change in cycle time.
Cash Conversion Cycle visualization examples
Comparison Chart
Cash Conversion Cycle
Line Chart
Cash Conversion Cycle
Chart
Measuring Cash Conversion CycleMore about Cash Conversion Cycle
Cash Conversion Cycle is financially important in your efforts to set expectations between a vendor and carrier, establishing a cadence of regular, predictable payments. In an asset-driven industry with products moving through your company quickly, keeping track of cash flows is a financial make or break for your business. This metric is also commonly referred to as Cash-to-Cash Cycle Time.
Aside from finances, cash-to-cash cycles can indicate changes in the health of your supply chain. Lower cycle times can symbolize a more profitable, lean business. Additionally, the metric can be a sign of how efficiently you’re using your assets and resources to deliver reliably.
Ideally, you should shoot for low cash-to-cash cycle times. However, your target number should result from a balanced consideration of supplier and customer needs.
A Cash Conversion Cycle that is too low may leave you with insufficient inventory or with late payments to suppliers. Your target metric should reflect your aim to meet the needs of all parties involved.
Monitoring Cash Conversion Cycle will benefit both your asset management performance and financial tracking abilities.
Cash Conversion Cycle Frequently Asked Questions
Why do some highly successful companies like Amazon and Apple maintain negative Cash Conversion Cycles, and is this always a positive indicator?
A negative Cash Conversion Cycle (CCC) indicates exceptional working capital efficiency where a company effectively receives payment from customers before paying suppliers, essentially using supplier financing to fund operations—but this isn't universally beneficial across all business contexts. Amazon's consistently negative CCC (approximately -20 to -30 days) stems from collecting customer payments immediately while negotiating 60+ day payment terms with suppliers, creating a significant cash flow advantage that helped fund its massive expansion without proportional external capital. However, achieving a negative CCC often requires substantial market power or scale advantages that smaller companies simply cannot replicate; when smaller retailers attempt to push for extended supplier terms without the leverage of an Amazon or Walmart, they often damage supplier relationships and risk inventory shortages. Additionally, certain industries like luxury goods or specialized manufacturing deliberately maintain longer CCCs as part of their value proposition—premium watchmakers with 200+ day CCCs reflect quality craftsmanship requiring longer production cycles rather than operational inefficiency. The negative CCC strategy also potentially transfers financial strain to suppliers, which can backfire if it weakens critical partners in your supply chain or damages your reputation within your industry ecosystem.
How should Cash Conversion Cycle be interpreted differently across growth stages, and when might a deteriorating CCC actually signal positive developments?
The Cash Conversion Cycle requires nuanced interpretation across company growth stages, with seemingly "deteriorating" metrics sometimes indicating strategic success rather than operational deficiency. Early-stage companies typically start with artificially favorable CCCs due to limited inventory and supplier leverage, but successful growth often temporarily lengthens the cycle as these businesses scale inventory to meet increasing demand and extend more generous payment terms to attract larger customers—an e-commerce company might see its CCC increase from 15 to 45 days during a high-growth phase as it builds inventory for expanded product lines and offers Net-60 terms to enterprise clients. Conversely, a suddenly improving CCC in a mature company might appear positive but actually signal demand problems—a manufacturer whose CCC drops from 60 to 30 days might be experiencing inventory clearance due to declining sales rather than improved operations. The metric also evolves with business model transitions; software companies shifting from perpetual licenses (immediate payment) to subscription models (extended revenue recognition) typically see CCC extend during the transition period before eventually improving beyond original levels. Without considering these growth context factors, analysts risk misinterpreting natural cyclical expansions as operational failures or temporary improvements as sustainable efficiencies.
How can companies effectively benchmark their Cash Conversion Cycle against competitors given the significant industry variations, and what related metrics provide complementary insights?
Effective Cash Conversion Cycle benchmarking requires careful industry segmentation and analysis of complementary metrics to avoid misleading comparisons across fundamentally different business models. Retail segments demonstrate this challenge clearly—grocery retailers typically maintain CCCs of 10-15 days due to rapid inventory turnover and perishability concerns, while specialty retailers average 60-90 days, making cross-segment comparisons meaningless without proper context. Rather than focusing solely on the aggregate CCC, analysts gain deeper insights by examining its components (DIO, DSO, DPO) independently against true peers; a retailer might match competitors' overall 45-day CCC but achieve this through concerning imbalances like extended supplier payments (high DPO) offsetting inefficient inventory management (high DIO). Additionally, the CCC should be analyzed alongside gross margin return on investment (GMROI) to assess whether longer cycles generate compensatory returns—luxury brands typically justify their extended 120+ day CCCs through substantially higher margins than fast-fashion retailers with 30-day cycles. For comprehensive working capital analysis, experienced analysts also track CCC variability across seasons and growth periods, recognizing that a company maintaining a consistent 40-day CCC throughout the year demonstrates more sophisticated working capital management than one fluctuating between 20 and 60 days, even if both average the same annual figure.
Contributor
