Net MRR Churn Rate
Last updated: Jul 24, 2025
What is Net MRR Churn Rate?
Net Monthly Recurring Revenue (MRR) Churn Rate is the percentage change in MRR from existing customers due to expansions, cancellations, and downgrades. A negative Net MRR Churn Rate occurs when expansions exceed downgrades and cancellations and is a strong positive indicator of company health. This metric is typically expressed as a monthly rate, although it can also be calculated as an annual rate: Net Annual Recurring Revenue (ARR) Churn Rate.
Net MRR Churn Rate Formula
How to calculate Net MRR Churn Rate
Example A: A company's starting MRR is $50,000 with expansions of $7,000 and downgrades and cancellations of $10,000. The Net MRR Churn Rate is ($10,000 - $7,000) ÷ $50,000 = 6.0% Example B: A company's starting MRR is $100,000 with expansions of $12,000 and downgrades and cancellations of $7,000. The Net MRR Churn Rate is ($7,000 - $12,000) ÷ $100,000 = -5.0%
Start tracking your Net MRR Churn Rate data
Build and track this metric in PowerMetrics, a modern analytics platform that lets you define metrics and connect your own data.
Get PowerMetrics FreeWhat is a good Net MRR Churn Rate benchmark?
The most successful SaaS companies achieve negative Net MRR Churn Rates, meaning that expansions outweigh downgrades and cancellations. Best-in-class companies typically target monthly Net MRR Churn rates between -2% to -5% (equivalent to Net Revenue Retention rates of 102% to 105% monthly, or 125% to 180% annually). Early-stage companies should aim to reach break-even (0% Net MRR Churn) before focusing on negative churn. Companies with positive Net MRR Churn rates above 5% monthly may face sustainability challenges without strong new customer acquisition.
Net MRR Churn Rate benchmarks
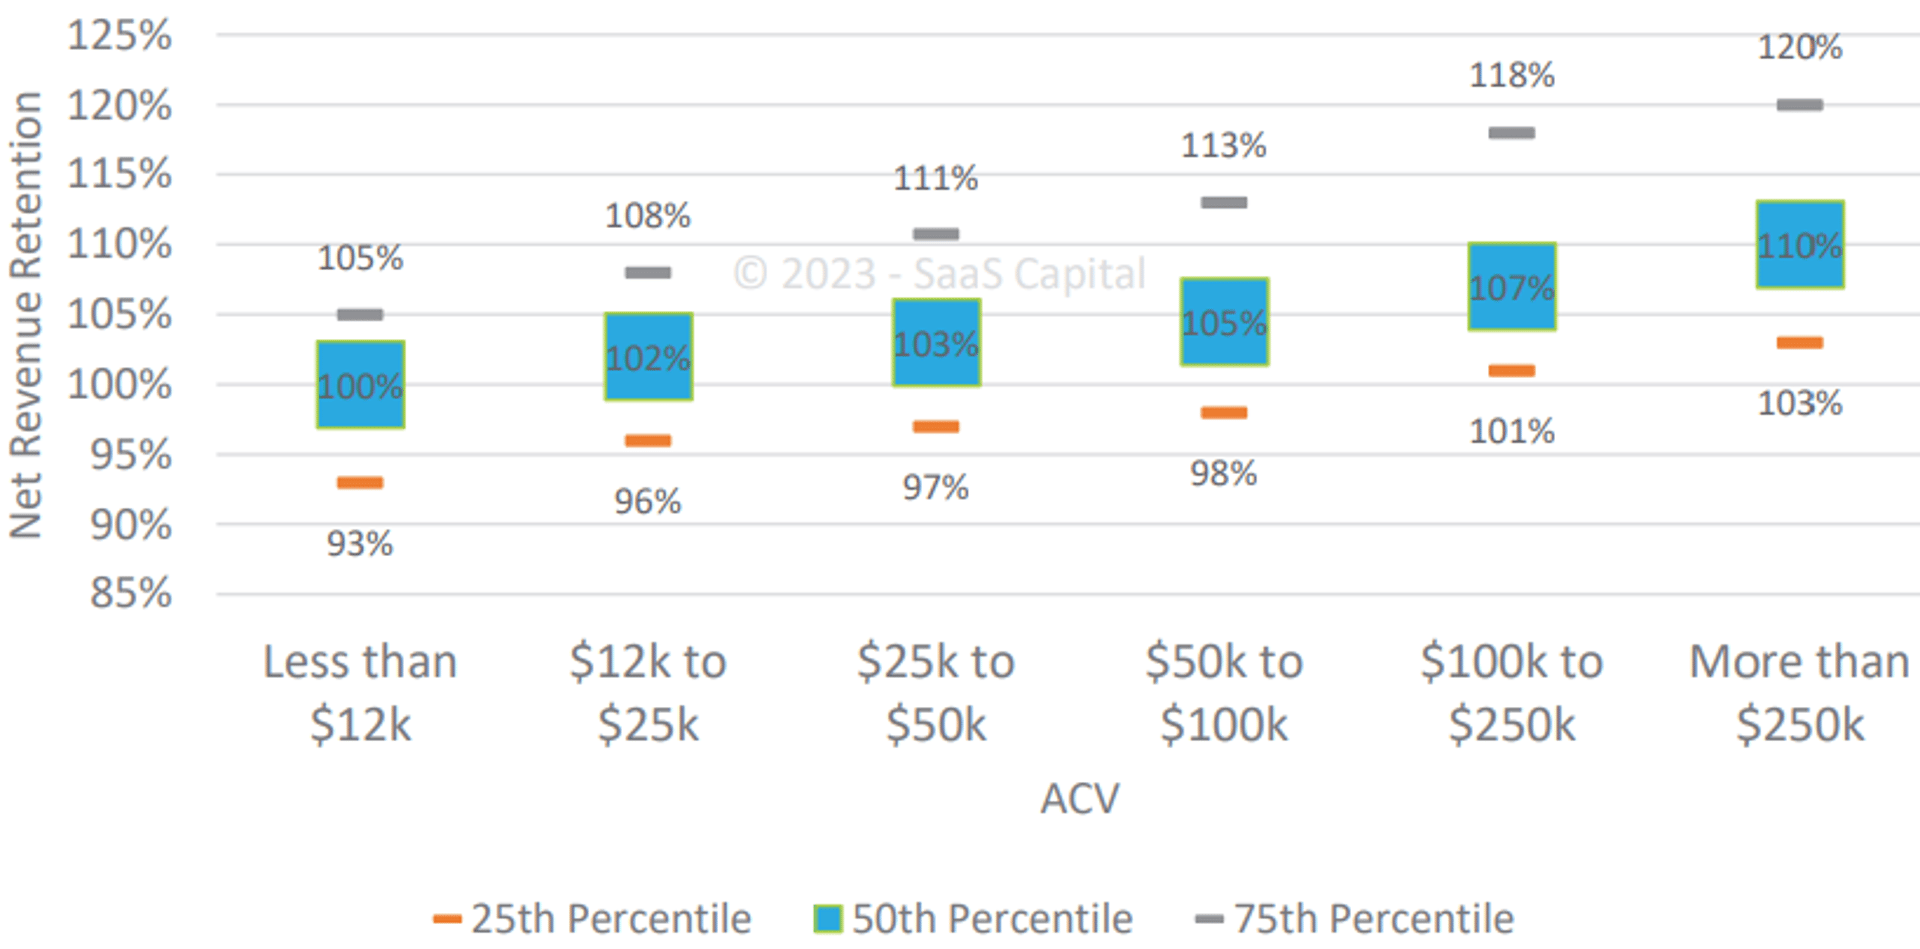
Net Dollar Retention Rate by ACV

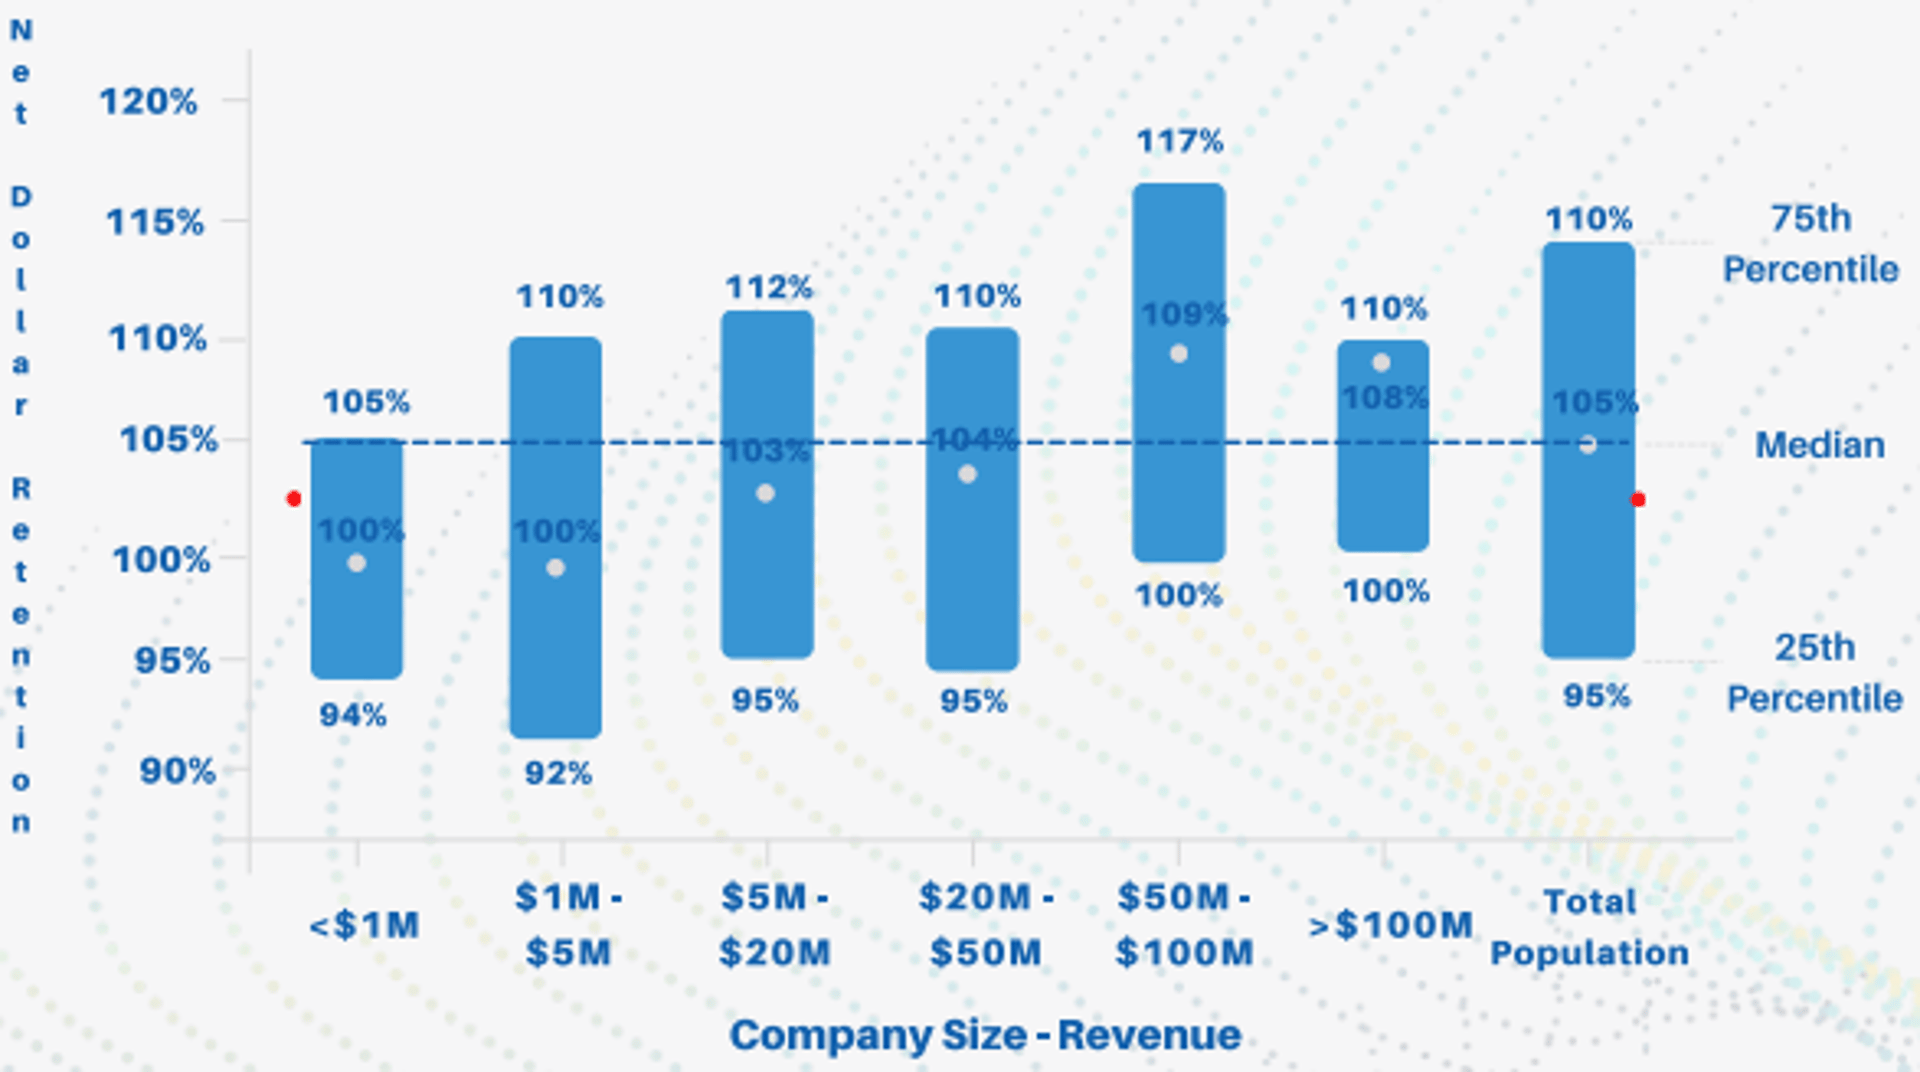
Net Revenue Retention Rate by Revenue

Net Revenue Retention Rate by Revenue

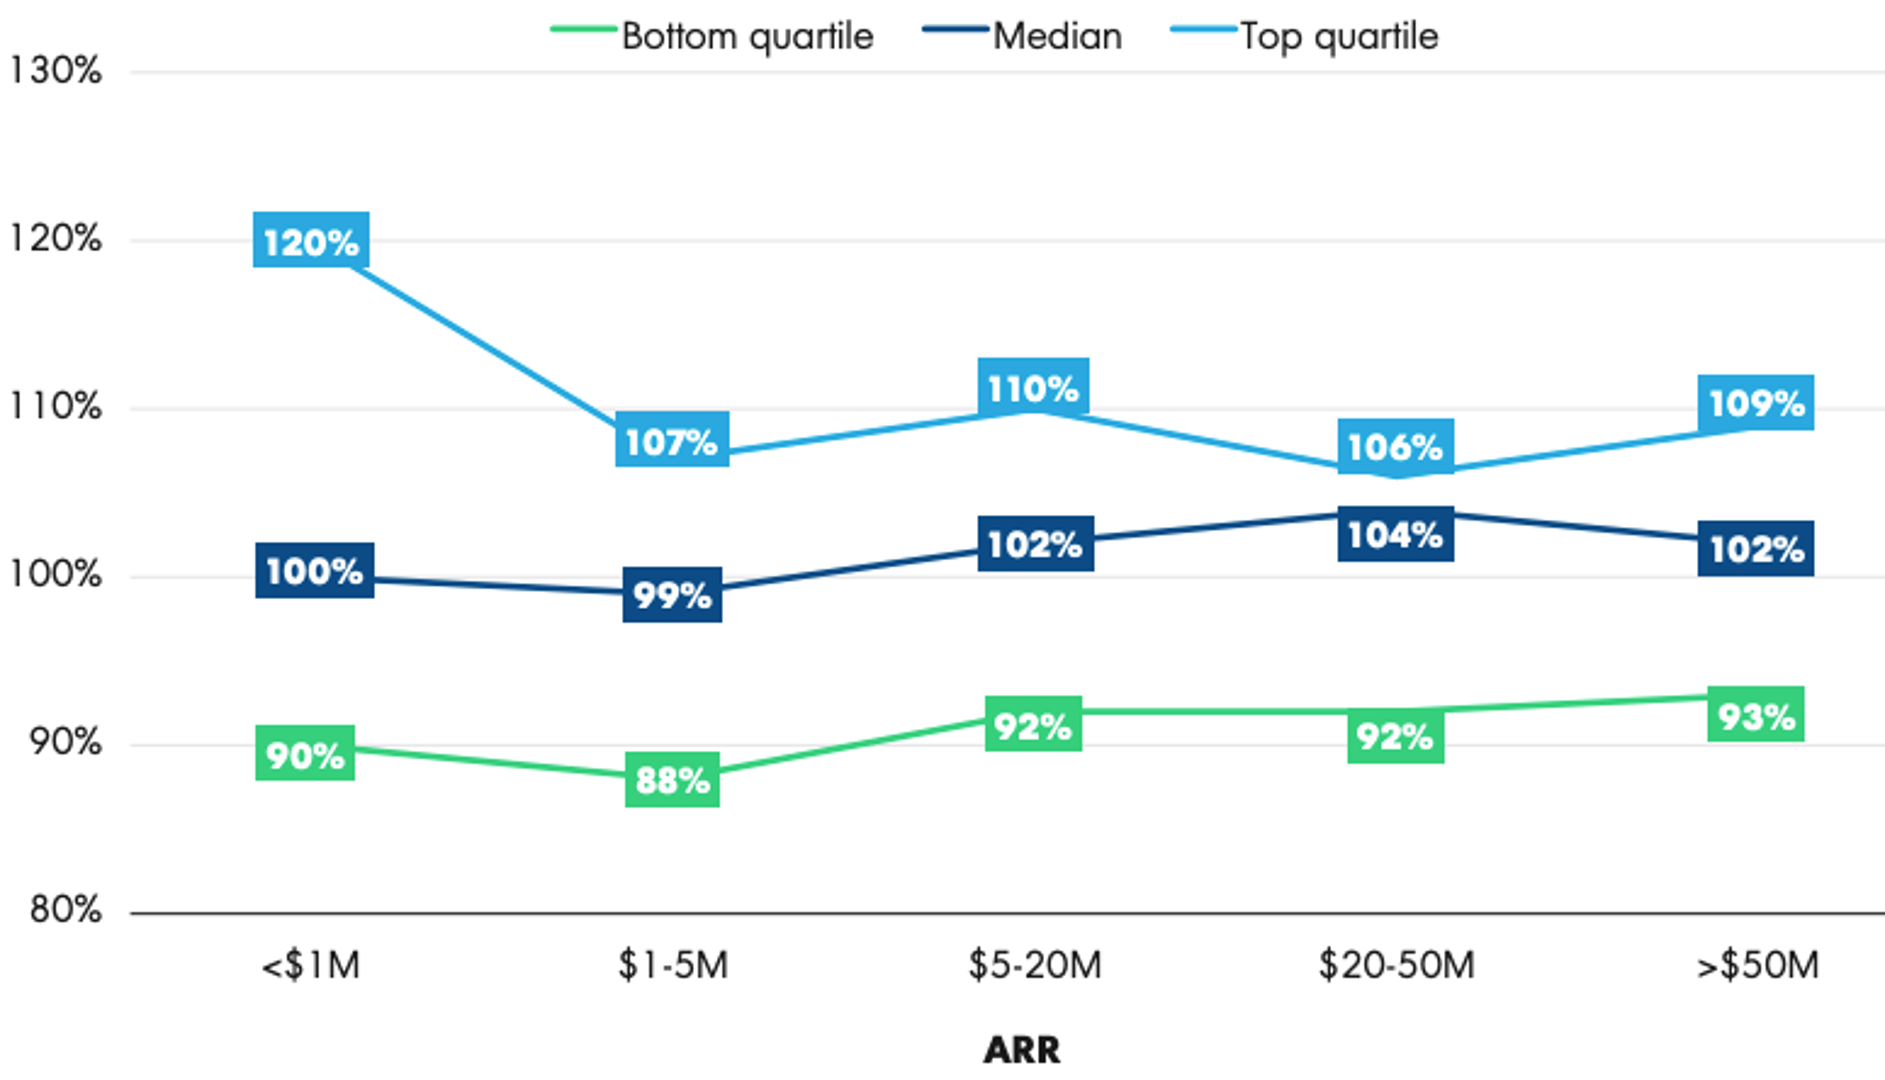
Annual Net Retention Retention Rate by ARR

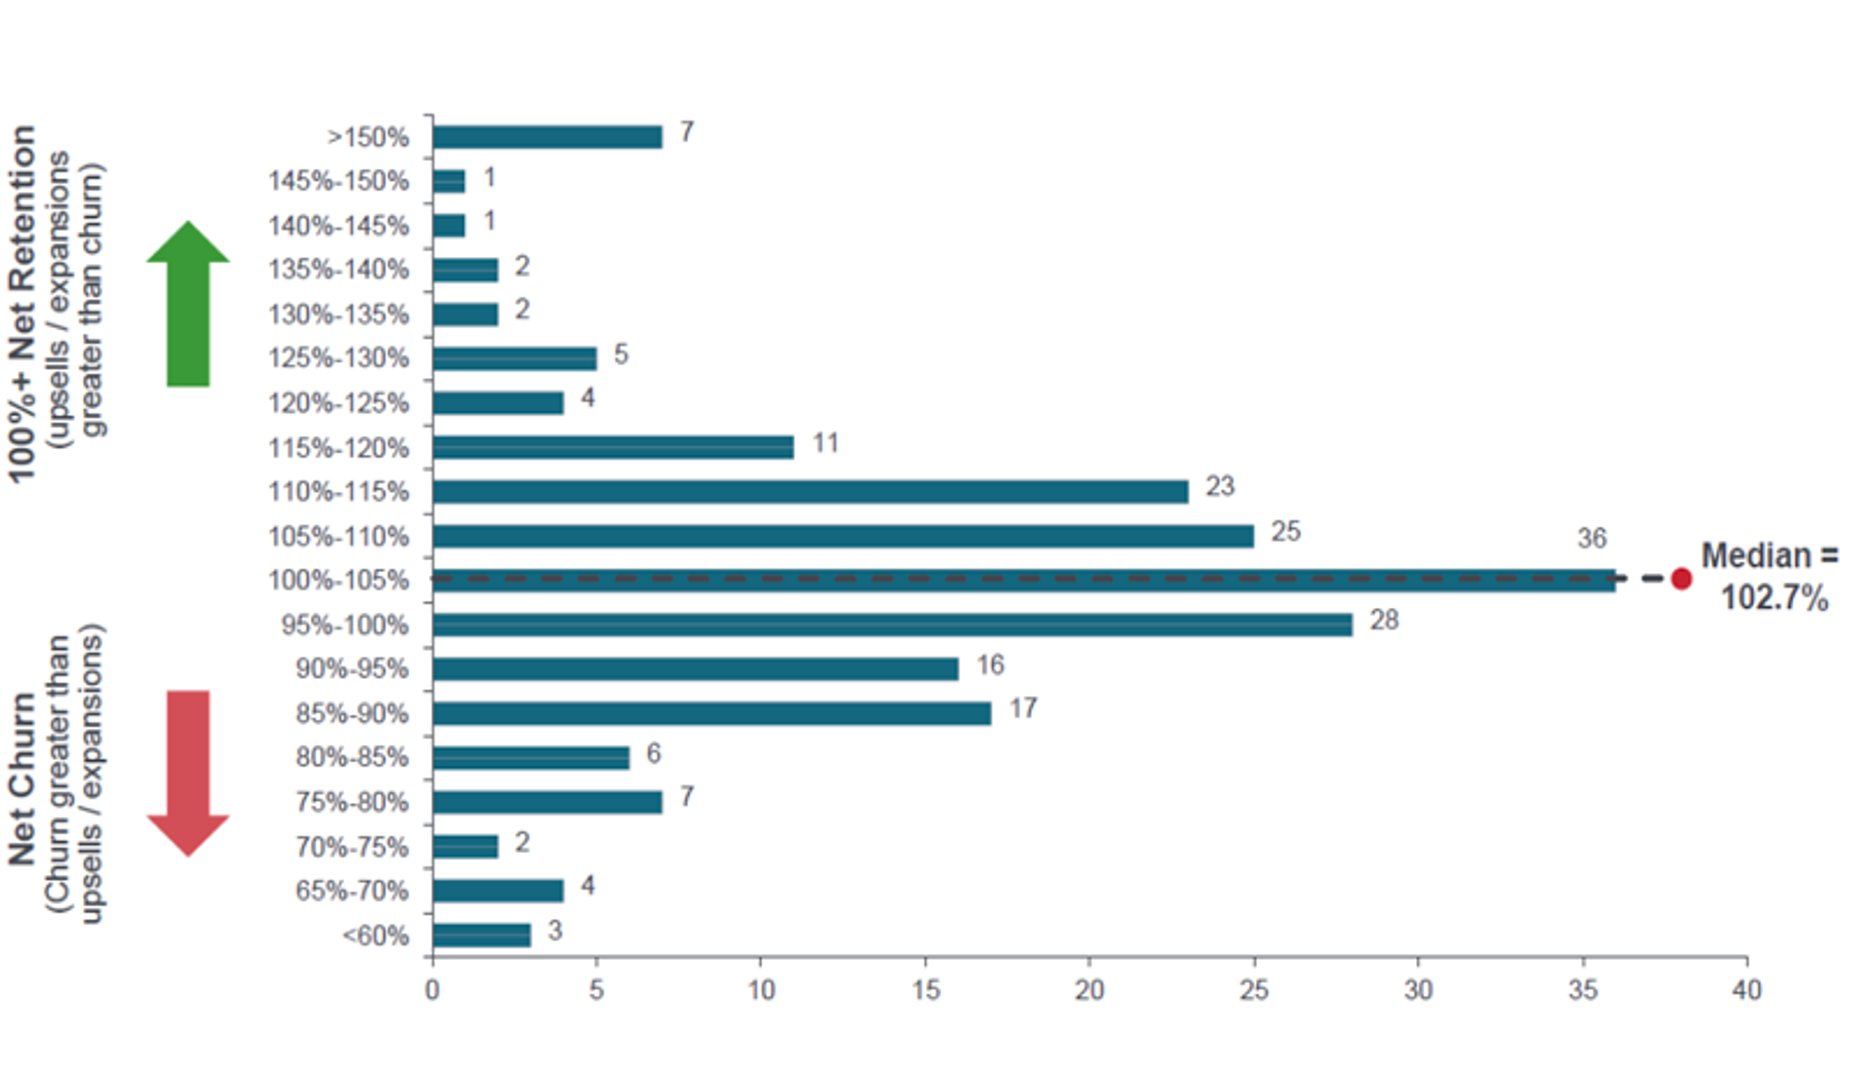
Annual Net Revenue Retention Rates

How to visualize Net MRR Churn Rate?
A line chart can help you optimally visualize your Net MRR Churn Rate data by letting you see how this metric trends over time. You can then adjust your strategy to meet your goals.
Net MRR Churn Rate visualization example
Net MRR Churn Rate
Line Chart
Net MRR Churn Rate
Chart
Measuring Net MRR Churn RateMore about Net MRR Churn Rate
In contrast to Gross MRR Churn Rate, which looks only at downgrades and cancellations, Net MRR Churn Rate incorporates expansions, downgrades, and cancellations from the existing customer base. Net MRR Churn Rate is a critical KPI for subscription-based companies because the cost of retaining and growing existing customers is typically much lower than acquiring new ones. Additionally, existing customers represent predictable future revenue streams and often have higher lifetime values. The metric provides insight into whether a company can grow revenue from its current customer base without relying solely on new customer acquisition.
When interpreting Net MRR Churn Rate, consider it alongside customer segmentation analysis to understand which customer cohorts are driving expansion versus contraction. High-value enterprise customers may show different churn patterns compared to small business segments, and tracking this metric by customer tier reveals where to focus retention and expansion efforts. Companies should also monitor trends over time rather than focusing on single-month snapshots, as seasonal factors, product launches, or economic conditions can create temporary fluctuations.
For operational application, teams should establish clear thresholds for action: positive churn rates above 3-5% monthly may require immediate intervention through customer success initiatives, while consistently negative rates indicate opportunities to scale expansion strategies. The metric becomes particularly valuable when combined with leading indicators such as product usage metrics, support ticket volumes, and customer satisfaction scores, enabling proactive rather than reactive management.
Net MRR Churn Rate also serves as a key input for financial forecasting and growth planning. Companies with negative churn can model more aggressive growth scenarios, while those with positive churn need stronger new customer acquisition to maintain growth trajectories. The metric is calculated by taking the net change in MRR (downgrades and cancellations minus expansions) for the period and dividing by the total MRR at the start of the period.
Net MRR Churn Rate Frequently Asked Questions
Are the metrics Net MRR Churn Rate and Net Revenue Retention Rate the same, just the inverse?
No, net MRR churn rate and Net Revenue Retention (NRR) are not the same - they're actually inverse metrics that measure related but different aspects of revenue performance.
Net MRR Churn Rate measures the percentage of recurring revenue lost over a period, calculated as: (Revenue lost from churned customers - Revenue gained from expansions) / Starting MRR
Net Revenue Retention (NRR) measures the percentage of revenue retained and grown from existing customers, calculated as: (Starting MRR + Expansion MRR - Churned MRR - Contraction MRR) / Starting MRR
The key relationship is that NRR = 100% - Net MRR Churn Rate. So if you have an NRR of 110%, your net MRR churn rate would be -10% (meaning you actually grew revenue from your existing customer base). Conversely, if your net MRR churn rate is 5%, your NRR would be 95%.
Practical differences:
- NRR is typically expressed as a percentage above or below 100% (like 95% or 115%)
- Net MRR churn rate can be positive (net loss) or negative (net gain)
- NRR above 100% indicates growth from existing customers
- Negative net MRR churn rate indicates the same growth
Most SaaS companies prefer to report NRR because values above 100% clearly communicate growth, while negative churn rates can be confusing to stakeholders.
Should I track Net MRR Churn monthly or annually?
Most SaaS companies track Net MRR Churn monthly for operational insights and trend identification, but report it annually for strategic planning and investor communications. Monthly tracking helps identify seasonal patterns and rapid changes in customer behaviour, while annual figures provide a clearer picture for benchmarking against industry standards and long-term planning.