Gross MRR Churn Rate
Last updated: Jul 22, 2025
What is Gross MRR Churn Rate?
Gross Monthly Recurring Revenue Churn Rate (Gross MRR Churn Rate) is the percentage of recurring revenue lost due to both cancellation and downgrades. Note that it is common to express this metric as a monthly rate, though it can also be expressed as Gross ARR Churn Rate.
Gross MRR Churn Rate Formula
How to calculate Gross MRR Churn Rate
For example, if the total MRR churned (downgraded and cancelled) this month was $2000 and the total MRR (measured at the start of the month) is $100,000, then the Gross MRR Churn Rate would be 2%. $2000 (churn for entire month) / $100,000 (MRR as of beginning of month) = 0.02 or 2%
Start tracking your Gross MRR Churn Rate data
Build and track this metric in PowerMetrics, a modern analytics platform that lets you define metrics and connect your own data.
Get PowerMetrics FreeWhat is a good Gross MRR Churn Rate benchmark?
Best in class MRR churn for enterprise companies is 1% per month. For small and mid-size focused businesses, that number is between 2% and 2.5%. At 5% annually, you're losing half of your subscription revenue every year.
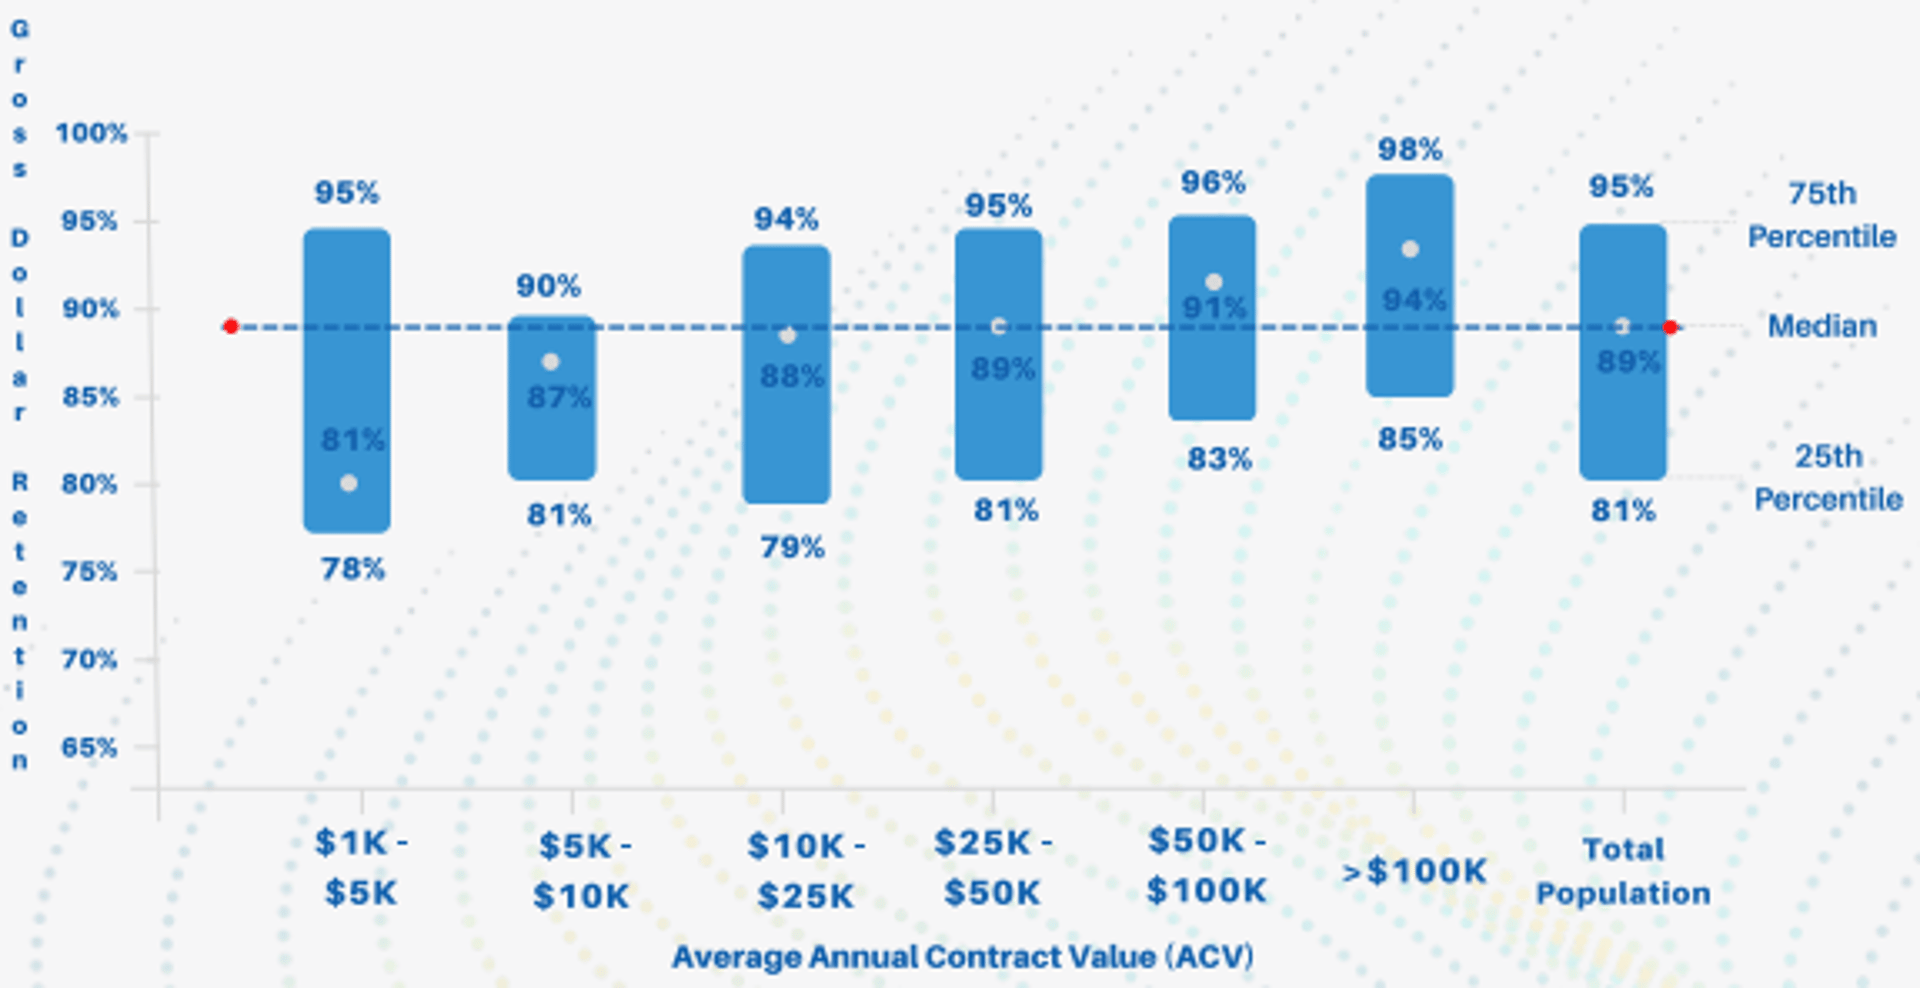
Gross MRR Churn Rate benchmarks
Gross Revenue Retention by ACV

How to visualize Gross MRR Churn Rate?
A line chart can help you optimally visualize your Gross MRR Churn Rate data by letting you see how this metric trends over time. You can then adjust your strategy to meet your goals.
Gross MRR Churn Rate visualization example
Gross MRR Churn Rate
Line Chart
Gross MRR Churn Rate
Chart
Measuring Gross MRR Churn RateMore about Gross MRR Churn Rate
In contrast to Net MRR Churn Rate that looks at expansion, downgrades, and cancellations, Gross MRR Churn reports only downgrades and cancellations.
Gross MRR Churn Rate is a critical KPI for subscription-based companies, because as the number of customers scale, a high churn rate will eventually surpass growth. High churn rates also point to fundamental product-market fit problems, buyer remorse, or an increasingly competitive landscape.
Calculate Gross MRR Churn Rate by dividing the total MRR churn (for the month) by the total MRR (at the beginning of the month).
Gross MRR Churn Rate Frequently Asked Questions
How does Gross MRR Churn Rate influence decisions around customer segmentation and lifecycle marketing?
Gross MRR Churn Rate can reveal which customer segments are most at risk of churning, especially when analyzed alongside attributes like company size, industry, pricing tier, or onboarding experience. By isolating churn patterns within specific cohorts, revenue and marketing leaders can tailor lifecycle campaigns—such as proactive education, upsell readiness, or renewal incentives—to reduce churn in high-risk groups. This insight supports smarter segmentation and prioritization, ensuring retention resources are focused where they’ll have the greatest impact.
What’s the relationship between Gross MRR Churn Rate and product-market fit, and how should leaders interpret high churn in this context?
A persistently high Gross MRR Churn Rate can signal a misalignment between product value and customer expectations—often a deeper issue than pricing or support. For early-stage SaaS companies, it may indicate the need to revisit core use cases, positioning, or onboarding. For later-stage companies, high churn may reflect weak stickiness or commoditization. Leaders should interpret Gross MRR Churn not just as a financial red flag, but as a strategic indicator of how well the product meets customer needs in a competitive market.
How can teams balance improving Gross MRR Churn Rate with pursuing aggressive new customer growth?
While net new MRR often grabs attention, ignoring Gross MRR Churn undermines long-term scalability. High churn increases the cost of growth and reduces customer lifetime value (LTV), making new acquisition less profitable. To balance both goals, revenue and marketing leaders should build feedback loops: use insights from churned customers to improve acquisition targeting, and ensure new customers receive value quickly through strong onboarding. Prioritizing quality growth—customers who are more likely to stay—leads to healthier Gross MRR Churn over time.
Contributor
