Video Conversion Rate is the percentage of video views that lead to a defined conversion action, such as a click, sign-up, or purchase.
It shows whether your video persuades people to act, not just whether they watch. Marketers use it to compare videos, channels, and audiences, and to decide which creative deserves more budget. A video with many views and a low Video Conversion Rate attracts attention but doesn't move people toward your goal.
A skincare brand runs a 30-second product video ad. Over one week, it records 10,000 video views. During that time, 150 viewers click the "Shop now" button. The brand defines a conversion as a click on that button.
- Count conversions: 150 button clicks.
- Count video views: 10,000.
- Divide: 150 / 10,000 = 0.015.
- Multiply by 100: 1.5%.
The Video Conversion Rate is 1.5%. For every 100 views, about one and a half people take the action the brand wanted. If a second video converts at 2.5% on the same audience, it is persuading more viewers to act.
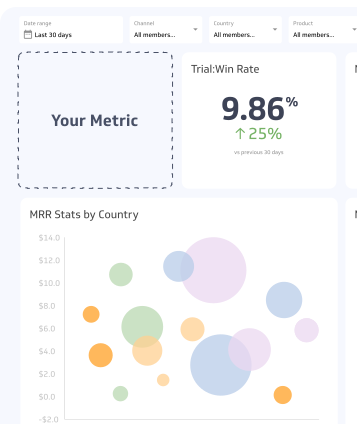
Line charts and summary charts are both great visualizations to gather insights from your metrics at a glance. Take a look at the examples:
Common variations
Video Conversion Rate has no single universal definition. Two teams can report different numbers for the same video because they chose a different conversion or a different denominator.
| Variation | What changes | When it fits |
|---|
| Views as the denominator | Divides conversions by video views | Standard version; works when a view threshold is consistent |
| Impressions as the denominator | Divides conversions by times the video was shown | Useful when comparing against ad reach or when views are not tracked consistently |
| Unique viewers as the denominator | Divides conversions by distinct people who watched | Better when the same people watch repeatedly |
| Click-based conversion | Counts clicks on links or calls to action | Traffic or lead generation goals |
| Outcome-based conversion | Counts sign-ups, purchases, or demo requests | Revenue or pipeline goals |
| View-through conversion | Counts people who watched and converted later without clicking | Longer buying cycles; depends on the platform's attribution window |
Platforms also define a "view" differently. Some count a view after a few seconds, others after 30 seconds or at completion. A shorter threshold raises the denominator and lowers the rate. Check each platform's definition before comparing results across channels.
What drives Video Conversion Rate up or down
Several factors influence the result:
- Call to action clarity. A single, specific prompt at the right moment converts better than several competing ones.
- Audience match. A video shown to people who already need the product converts more than one shown to a broad audience.
- Video length and pacing. Viewers who drop off before the call to action can't convert. Put the key message early.
- Placement. The same video can perform differently on a landing page, in a social feed, or in an email.
- Landing experience. A slow or confusing page after the click lowers conversions even when the video works.
- Offer strength. Price, incentive, and trust signals all affect whether a viewer acts.
Best practices
Set the conversion definition before the campaign starts, and write it down. Changing it midway makes earlier results impossible to compare.
Segment results by video, channel, audience, and device. A blended rate can hide a strong video on one channel and a weak one on another.
Test one change at a time, such as the thumbnail, the opening, or the call to action. Then you know which change moved the rate. Wait for enough views to trust the difference; small samples swing widely.
Pair the rate with related measures. Video Conversion Rate tells you whether viewers acted. Completion measures tell you how much of the video they watched. Cost per conversion tells you whether the result was worth the spend.
Common challenges
Mixing conversion types. Adding clicks, play clicks, and purchases into one count inflates the rate and blurs its meaning. A click to start the video is engagement with the player, not a business outcome. Count only actions that match your goal.
Double counting. One viewer who clicks a link and then purchases can be counted twice if both actions are treated as conversions. Count each viewer once per conversion goal, or report each action as its own rate.
Inconsistent view definitions. Comparing a platform that counts three-second views with one that counts 30-second views gives misleading results. Standardize the threshold where you can, and note the difference where you can't.
Attribution gaps. Many viewers convert later, on another device, or after seeing other marketing. Rates based only on direct clicks understate the video's influence, while generous view-through windows can overstate it. State the attribution window you use.
Small samples. A video with 200 views and 6 conversions shows 3%, but one extra conversion moves it half a point. Wait for more data before drawing conclusions.
Related metrics
Video Conversion Rate sits at the end of a sequence of video measures. Views and view-through show reach and attention. Video clicks show interaction. Video Conversion Rate shows whether that attention led to the outcome you wanted. Tracking all of them shows where viewers drop off between watching and acting.