Link Clicks is the number of times people click a link in your ad text, media, or call-to-action. The link can lead to a destination on or off the platform where the ad runs.
The count shows how many people took the first step you asked for, whether that was visiting a product page, a landing page, or your business profile. It's one of the most direct signs that an ad's message and offer earned attention. Use it to compare ads, creative, and audiences, and to decide which ones deserve more budget.
ƒ Link Clicks = Count of clicks on links in an ad's text, media, or call-to-action
A personal safety equipment manufacturer publishes a Facebook ad with a link to its online store. After the ad runs for a week, the platform reports that people clicked the link 1,000 times.
- Count each click on the ad's link, button, or linked image: 1,000.
- Leave out reactions, comments, and shares, which are not link clicks.
- Link Clicks = 1,000.
In plain terms, the ad sent 1,000 visits toward the store. Whether those visits led to sales depends on what happens after the click.
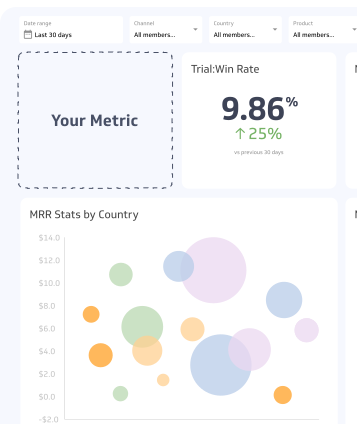
You have mainly two options when visualizing your Link Clicks data. First, a summary chart can help you get the most straightforward view of your data by displaying your current value, perhaps with a comparison to past values. Second, a bar chart can display your data segmented by geography, campaign, social media platform, or more, helping you fine tune your strategies specific to each target segment.
How to use Link Clicks
Link Clicks tells you whether an ad moves people from seeing to acting. It works best as a comparison tool: the same ad against a new version, one audience against another, or one placement against another.
Compare ads, audiences, and placements
Raw counts only compare fairly when ads have similar reach and budget. An ad with 1,000 clicks from 100,000 impressions performs differently from an ad with 1,000 clicks from 20,000 impressions. Pair the count with Click-Through Rate to see how many people clicked relative to how many saw the ad.
Use it as an early signal
Link Clicks is a leading indicator. It shows interest within hours of launch, long before sales or sign-ups are complete. That makes it useful for early creative testing. It does not show revenue, so confirm results with a downstream metric such as Conversion Rate.
Adjust by goal and stage
| Goal | How to read Link Clicks |
|---|
| Traffic | The main success measure; pair it with cost per click and landing page views |
| Lead generation | An early signal; judge ads by leads gathered, not clicks alone |
| Sales | A top-of-funnel input; judge ads by purchases and return on ad spend |
| Awareness | A secondary signal; reach and impressions matter more |
What changes Link Clicks
Several factors raise or lower the count:
- Audience and targeting. People who already know your brand or match your ideal customer click more often.
- Creative and copy. A clear benefit, a visible link, and a specific call-to-action tend to draw more clicks than vague messaging.
- Placement. Feeds, stories, and sidebars produce different click behaviour, and the same ad can vary widely between them.
- Budget and reach. More impressions mean more chances to click, so the count rises with spend even when quality doesn't.
- Link position. A link in the media or button is often easier to click than one buried in long ad text.
Common variations in definition
- Total vs. unique clicks. Some platforms count every click; others report unique people who clicked. One person clicking three times is three total clicks but one unique click.
- Link clicks vs. all clicks. Link Clicks counts only clicks that lead to a destination. Meta reports "Clicks (all)" separately, which also includes reactions, comments, shares, and profile or image expands.
- On-platform vs. off-platform destinations. A link to your business page stays on the platform. A link to your website leaves it. Both can count, but only off-platform clicks can show up in your website analytics.
Common pitfalls
Treating clicks as results
A high count can hide a weak offer or a poor landing page. If people click and leave, you pay for traffic that doesn't convert. Review bounce rate, landing page views, and conversions alongside clicks.
Mismatched numbers between tools
Ad platforms and web analytics tools rarely match exactly. A person can click and close the page before it loads, so the platform records a click while your analytics records no visit. Compare Link Clicks with landing page views to estimate how many clicks never arrive.
Accidental and invalid clicks
Mis-taps on mobile and automated traffic can inflate the count. Platforms filter some invalid activity, but not all of it. Unusually high clicks with almost no conversions is a sign to investigate placements and audiences.
Comparing across platforms
Each platform defines a click differently. Compare trends within one platform, and use your own analytics as the common reference when you compare across channels.
Best practices
- Track the right definition. Choose Link Clicks rather than all clicks when your goal is traffic.
- Tag your links. Add UTM parameters so your analytics tool can attribute visits to the ad, campaign, and creative.
- Test one change at a time. Change the headline, image, or call-to-action separately so you know what moved the count.
- Look at cost. Divide spend by Link Clicks to get cost per link click, and compare it across ads.
- Follow the click. Check what visitors do after they arrive, so you can fix the landing page when clicks are healthy but results are not.
Related metrics
- Click-Through Rate divides clicks by impressions, so it shows click performance independent of ad reach.
- Cost per Link Click shows how much each click costs.
- Landing Page Views counts the clicks that loaded your page.
- Conversion Rate shows how many visitors completed the action you wanted.