Enterprise Value to Revenue Multiple (EV/R)
Last updated: May 02, 2025
What is Enterprise Value to Revenue Multiple?
Enterprise Value to Revenue Multiple (EV/R) is a financial ratio used in company valuation that compares stock value of a company to its revenue for a given time period. EV/R is often used to evaluate a company before acquisition.
Enterprise Value to Revenue Multiple Formula
How to calculate Enterprise Value to Revenue Multiple
If a company’s Enterprise Value (EV) is $50M and revenue is $35M, then the company’s EV/R Multiple is 1.4X.
Start tracking your Enterprise Value to Revenue Multiple data
Build and track this metric in PowerMetrics, a modern analytics platform that lets you define metrics and connect your own data.
Get PowerMetrics Free
What is a good Enterprise Value to Revenue Multiple benchmark?
In general, a good EV/R Multiple is between 1x and 3x. However, public SaaS companies range between 6X and 12X EV/R.
Enterprise Value to Revenue Multiple benchmarks

How to visualize Enterprise Value to Revenue Multiple?
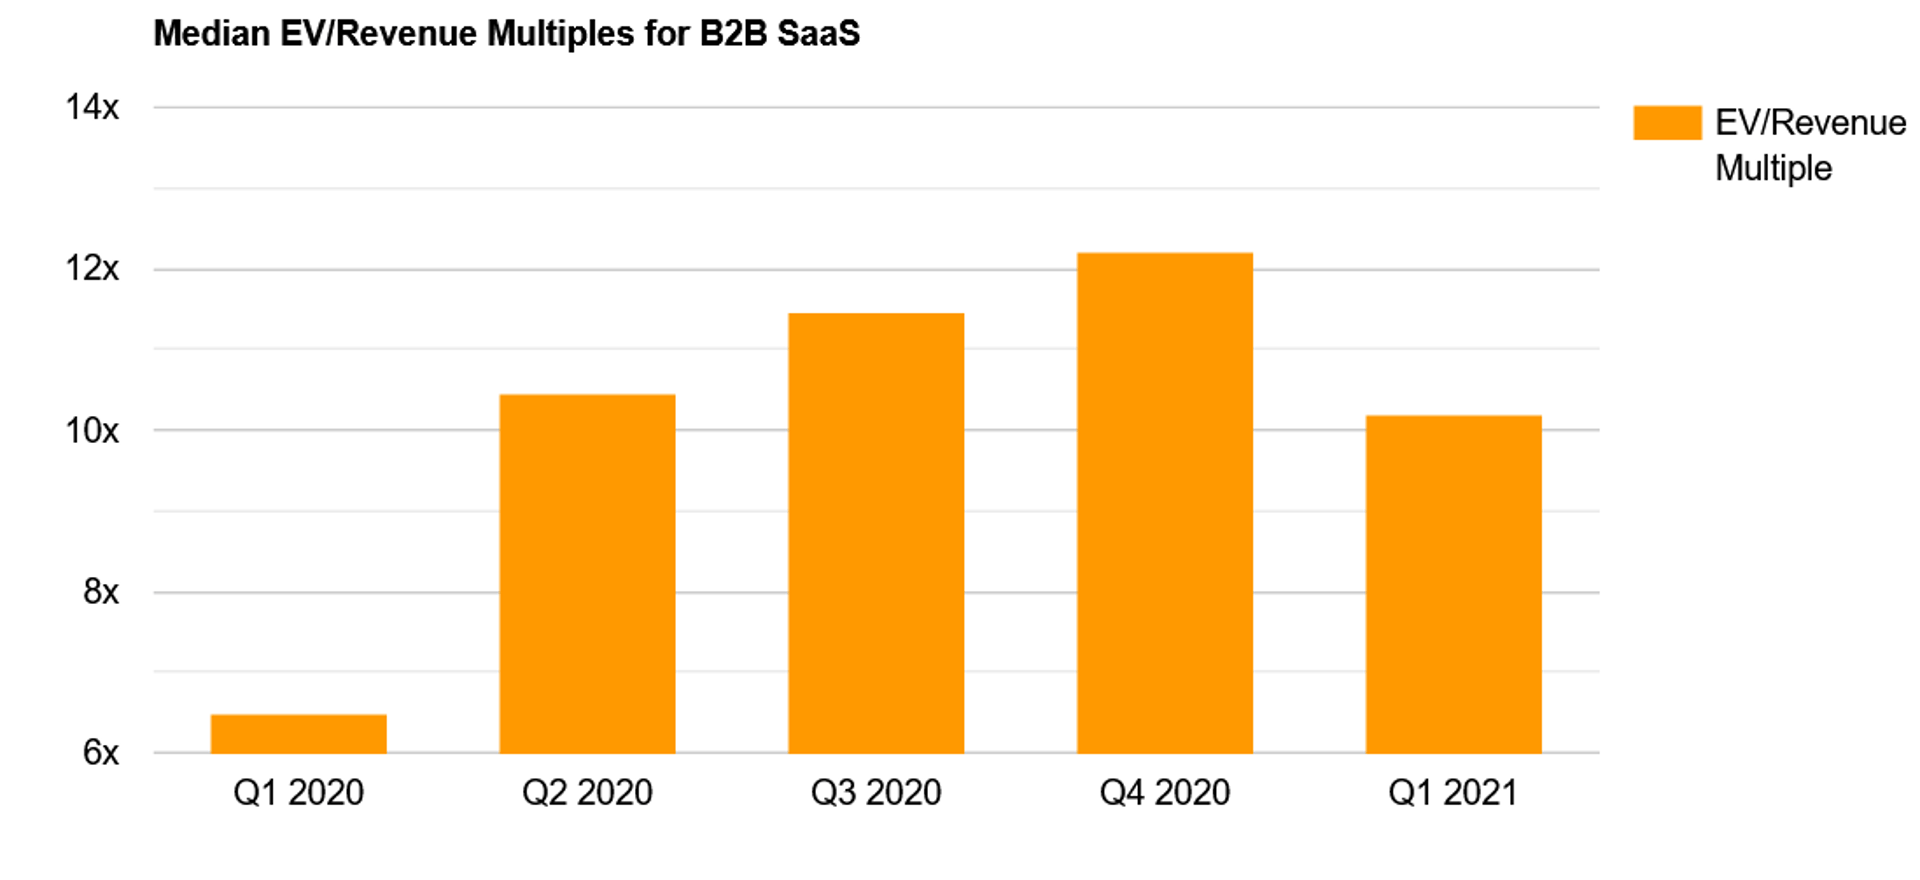
The EV/R Multiple is usually expressed as a single number. For example, your EV/R might be 1.5X. The best way to visualize this metric is with a summary chart. Take a look at the example to see what your EV/R data might look like when you start to track it on a dashboard:
Enterprise Value to Revenue Multiple visualization example

Summary Chart
Enterprise Value to Revenue Multiple
Chart
Measuring Enterprise Value to Revenue MultipleMore about Enterprise Value to Revenue Multiple
EV/R Multiple is used to value a company before a potential takeover, evaluate if the stock rice of a company is fair, and to compare companies in the same industry. It is calculated by dividing enterprise value by revenue and is usually expressed as a decimal number or multiple. This metric can be used to look at how well a company generates revenue and can be used even if the company is not yet profitable.
Enterprise Value to EBITDA (EV/EBITDA) ratios can vary widely even within the same industry due to several factors:
Growth trajectory makes a substantial difference. A company growing at 25% annually might command a 12x EV/EBITDA multiple, while its competitor growing at 5% might trade at 6x, despite selling similar products. Investors are willing to pay a premium for future growth potential.
Operational efficiency is another key factor. Companies with higher gross margins and better operational scalability typically receive higher multiples. For example, a SaaS company with 80% gross margins will generally have a higher EV multiple than one with 60% margins, as each dollar of revenue creates more enterprise value.
Market position and moat significantly impact valuations. A company with 40% market share and strong competitive advantages (like proprietary technology or network effects) will typically command higher multiples than a company with 10% share and easily replicable offerings.
Consider two healthcare IT companies: Company A has a proprietary platform with substantial switching costs, 30% annual growth, and 75% gross margins, trading at 14x EV/EBITDA. Company B offers more commoditized services, grows at 8% annually with 55% margins, and trades at 7x EV/EBITDA.
Enterprise Value is also evolves significantly throughout a company's growth journey. In early stages, EV is primarily based on potential rather than financials, with valuations driven by addressable market size and intellectual property. As companies enter their growth phase, EV typically increases dramatically while maintaining high multiples, with investors focusing on revenue growth rates even amid negative EBITDA. Upon reaching maturity, growth moderates and EV/EBITDA multiples compress to more traditional levels (typically 8-12x for healthy businesses). Finally, in decline stages, multiples contract sharply—even profitable companies may trade at 4-6x EV/EBITDA when revenue is declining.
And finally, when comparing Enterprise Values across different regions or markets, several critical adjustments are necessary. Country risk premiums often result in emerging market companies trading at significantly lower multiples than identical businesses in developed markets due to currency, political, and regulatory uncertainties. Interest rate environments fundamentally impact valuations, with higher rates reducing the present value of future cash flows and compressing EV multiples. Industry cycle positioning also requires careful normalization, as cyclical industries experience dramatic multiple changes throughout economic cycles. These factors explain why similar companies can have vastly different valuations based solely on their geographic location or prevailing economic conditions.
Recommended resources related to Enterprise Value to Revenue Multiple
How to value SaaS companiesContributor

